An ANOVA test is performed when we want to compare the mean of multiple groups. The null and alternative hypothesis will be very similar for every problem.

 at least one mean is different
Note: The null hypothesis will have means equal to the number of groups being compared.
EX:
If there are three groups, the null hypothesis will be: 
If there are four groups, the null hypothesis will be: 
But for every situation, the alternative hypothesis will remain the same.
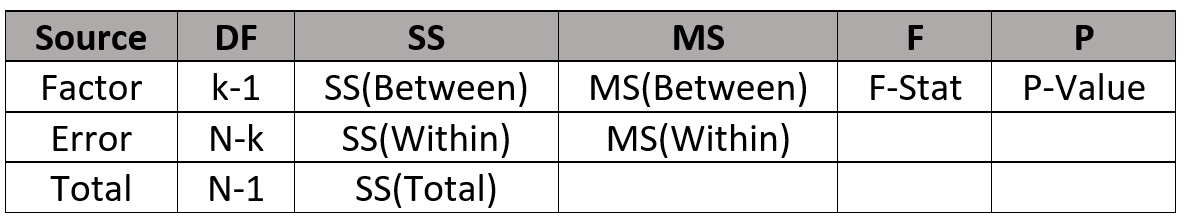
The key to tackling ANOVA problems is being able to understand the ANOVA table.
Source
The ANOVA table splits up variation in the data into two groups, Factor and Error. Factor is the variation between groups and Error is the variation within groups.
Degrees of Freedom (DF)
The DF for Factor is  , where
  is the number of groups there are. This should be the same amount of means we have in the null hypothesis. If we have four means (
 ), then is equal to four. The DF for Error is
  , where
  is the total sample size. If we have 20 people in our first group, 15 in the second, and 25 in the third, the total sample size () is 60. The DF for Total is also the sum of DF for Total and DF for Error.
Sum of Squares (SS)
The Sum of Squares column is the variation in our data. Sum of Squares Between (SSB) is the variation between our groups. It can also be called the Sum of Squares Groups (SSG) and Sum of Squares Treatment (SSTr) since it is the variation due to our factor. The formula to calculate SSB is:

The Sum of Squares Within (SSW) is the variation within groups, it can also be called Sum of Squares Error (SSE). This is the variation due to unexplained error or random error that arises in the data. The formula for SSW is:

The Sum of Squares Total (SST) measures the total variability that arises from multiple factors, the groups and random error. The formula for SST is:

Mean Squares
The Mean Squares column is the average variation in our data. The Mean Square Between (MSB) measures the average variability due to our factor/treatment. If the null hypothesis is true (all groups have equal means), this number should be small since it would mean the variation between sample means is due to chance.

The Mean Square Within or more commonly known as Mean Square Error (MSE) measures the average variability due to random error. If the null hypothesis is true, this is the amount of variation we would expect among the sample means.

F-Value
The F-Value is the test statistic for ANOVA. If the null hypothesis is true, then the F-Value will be closer to 1. So, if we have a large F-Value, we are more likely to reject the null hypothesis. It is also sometimes referred to as the “signal to noise” ratio.

P-Value
If the P-Value is less than our significance level, we reject the null hypothesis and conclude that at least one mean is different.
If the P-Value is greater than our significance level, we fail to reject (FTR) the null hypothesis and conclude all group means are equal.